IR >
Financial Highlights
Key Financial Information of Heerim
Financial Information
Assets
(UNIT : MIL, KRW)
| Category | 2020 | 2019 | 2018 | 2017 | 2016 | 2015 | 2014 | 2013 | 2012 |
|---|---|---|---|---|---|---|---|---|---|
| Total Assets | 167,856 | 161,634 | 134,524 | 134,552 | 143,417 | 142,496 | 138,944 | 129,241 | 127,550 |
| Current Assets | 126,314 | 125,042 | 107,933 | 108,094 | 117,105 | 119,369 | 118,376 | 108,515 | 107,862 |
| Non-current Assets | 41,542 | 36,592 | 26,591 | 26,458 | 26,313 | 23,127 | 20,568 | 20,726 | 19,688 |
| Property, Plant & Equipment | 2,416 | 2,557 | 2,411 | 2,216 | 3,330 | 1,713 | 7,406 | 7,680 | 8,025 |
| Intangible Assets | 2,264 | 2,770 | 3,680 | 4,371 | 2,992 | 3,254 | 3,510 | 3,174 | 1,960 |
Liabilities And Stock Holder's Equity
(UNIT : MIL, KRW)
| Category | 2020 | 2019 | 2018 | 2017 | 2016 | 2015 | 2014 | 2013 | 2012 |
|---|---|---|---|---|---|---|---|---|---|
| Total Liabilities & Stock Holder's Equity | 167,856 | 161,634 | 134,524 | 134,552 | 143,417 | 142,496 | 138,944 | 129,241 | 127,550 |
| Total Liabilities | 109,082 | 106,816 | 82,810 | 82,963 | 94,556 | 94,670 | 95,721 | 71,937 | 71,274 |
| Current Liabilities | 93,766 | 96,626 | 72,825 | 72,973 | 92,513 | 83,425 | 80,698 | 71,937 | 40,539 |
| Non-Current Liabilities | 15,316 | 10,190 | 9,985 | 9,989 | 2,043 | 11,245 | 15,022 | - | 28,465 |
| Total Stock Holder's Equity | 58,774 | 54,818 | 51,714 | 51,589 | 48,861 | 47,826 | 43,224 | 57,304 | 56,276 |
| Capital Stock | 6,961 | 6,961 | 6,961 | 6,961 | 6,961 | 6,961 | 6,961 | 6,961 | 6,961 |
| Retained Earnings | 51,274 | 48,264 | 45,869 | 44,575 | 42,159 | 41,296 | 37,648 | 52,245 | 51,571 |
Income
(UNIT : MIL, KRW)
| Category | 2020 | 2019 | 2018 | 2017 | 2016 | 2015 | 2014 | 2013 | 2012 |
|---|---|---|---|---|---|---|---|---|---|
| Net Income | 4,737 | 3,571 | 3,957 | 3,702 | 2,148 | 3,649 | -13,961 | 1,307 | 1,030 |
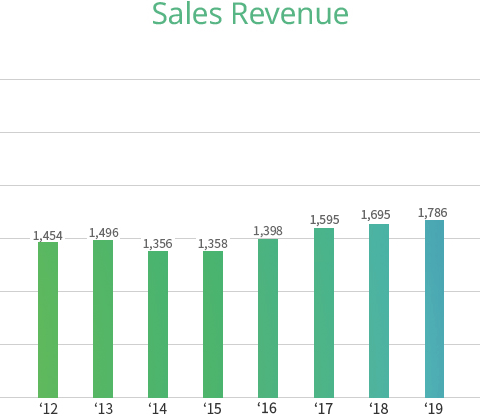
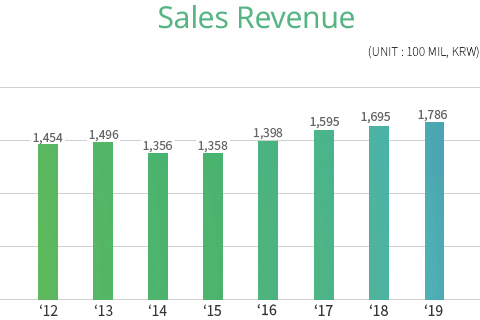
| Revenue | 203,869 | 178,561 | 169,470 | 159,493 | 139,773 | 135,771 | 135,642 | 149,638 | 145,373 |
| Gross Profits / Losses | 26,222 | 24,785 | 27,364 | 28,168 | 20,331 | 27,159 | 8,316 | 21,912 | 20,939 |
| Operating Income | 9,145 | 7,235 | 6,800 | 8,684 | 5,398 | 6,954 | -9,859 | 7,128 | 5,486 |
| Income Before Income Taxes Expense | 6,141 | 4,894 | 5,403 | 4,739 | 3,031 | 4,030 | -12,585 | 3,066 | 2,141 |